
Analyzing scraped data from 6 giant blogs with confirmed 100,000+ subscribers
You asked us to extend the analysis we did for OkDork posts from 2014 and here it is! Neville Medhora from KopywritingKourse gave us the data from six popular marketing blogs with more than 100,000 followers.
- OkDork blog by Noah Kagan,
- Backlinko blog by Brian Dean,
- ConversionXL blog by Peep Laja (no post date and no number of comments),
- IWillTeachYouToBeRich blog by Ramit Sethi (no number of comments),
- Quicksprout blog by Neil Patel,
- SocialTriggers by Derek Halpern.

The data contained basic information about post url, date posted, social share counts, headline, length of headline. We ran textual analytics on the post content and the headlines and added many additional metrics like post neutrality, headline neutrality, frequencies of most common words, weekday when posted, number of external links per post, etc. - 52 metrics in total.
The data here be found here: Blogdata
The question is: "Can we find out what's the perfect post recipe based on the data from marketing & blogging giants?"
The answer is as always right in the data! We did quite a bit of analysis with thisdata and created something cool for you to play with. Here is a structure of this fat and juicy post:
- Basic statistics. Comparing blogs with each other using main metrics.
- Trends for individual giants over time.
- Headline analysis. Explore best headlines by words used.
- Content analytics. Five post segments emerged from the textual analytics.
- Sentiment analytics. We analyzed sentiments of posts themselves and post headlines and made interesting discoveries.
Here is a summary of our findings:
- It's good to be consistent. All blogging giants with a large following consistently make between 10 and 40 posts per calendar quarter, i.e. between one and 3 posts per week. (Per blog the variance is very small).
- It's not true that there is a magic day to publish posts. For different blogs the best week day changes. The only certainty is that weekends work worse for social shares than workdays.
- It is not good to be neutral. Sentiment analysis of headlines and post content shows that neutrality is a negative driver for social shares and comments. Positive sentiment of the post content and headline drives most social shares. [Please, use with caution. Out data contained highly curated content from well respected authors.]
- If all posts are analyzed together the optimal post length to maximize tweets goes as far as 4000 words.
- Six distinct post groups emerge from all the posts we analyzed, and two of them have significantly higher number of shares per post. These groups have the following combination of core words: (1) test, page, conversion, customer, use, people, product, make, site, user, good, one, design, like, email, image, website, visitor, rate, need, and (2) content, link, site, traffic, social, search, use, blog, post, google, page, rank, image, people, infographic, create, like, make, write, share.
- Links to external websites are an important driver of popularity. For small posts of under 1000 words 8 to 10 external links are the optimum. Large posts require at least 50 links to hit the maximum sharing.
Blogs by the Numbers
We wanted to call this post: "Stand on the shoulders of marketing giants" for a reason. Six blogs have given us a list of 2,381 posts with whopping stats:
- 2,577,139 words
- 372,626 twitter shares
- 119,281 facebook shares and 135,095 facebook likes
- posted over 1795 days between 2004 and 2015
- 114,609 post comments.
People who write this goodness are machines! Many of us wonder how to get large following - we're afraid there are few shortcuts.
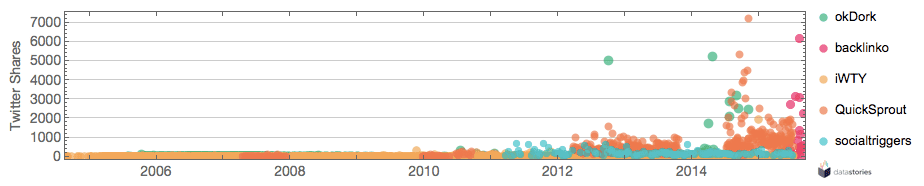
Look at the TWEETS of individual blog posts over time.
Look at the TWEETS of individual blog posts over time.
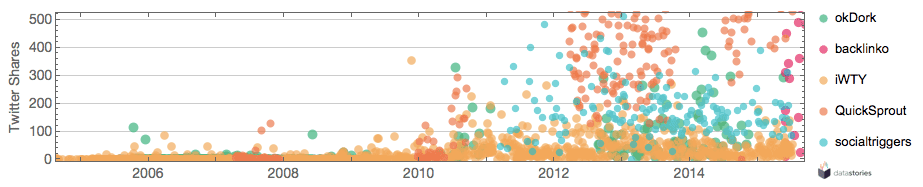
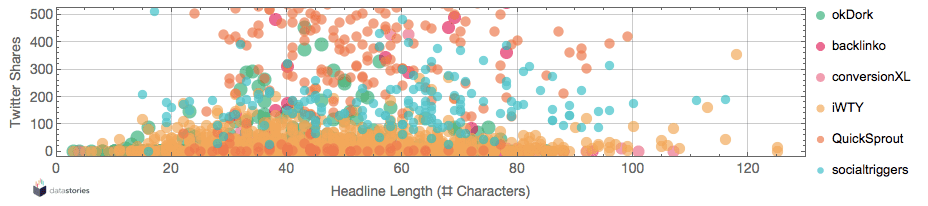
Here is a zoomed version for all posts with up to 500 TWEETS. Each dot is a carefully crafted story!
There is a lot of controversy about the ideal post length, day to post or ideal headline length. Let's look at our 6 blogs and see whether there are common patterns in their choices.
All possible headline lengths have been tried. Headlines with 40-65 words have high fraction of super-tweets:
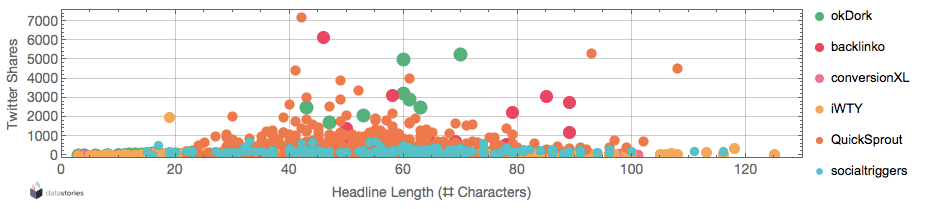
In a zoomed version we see that different blogs have different preferences and the high-popularity range of headline lengths is quite wide.
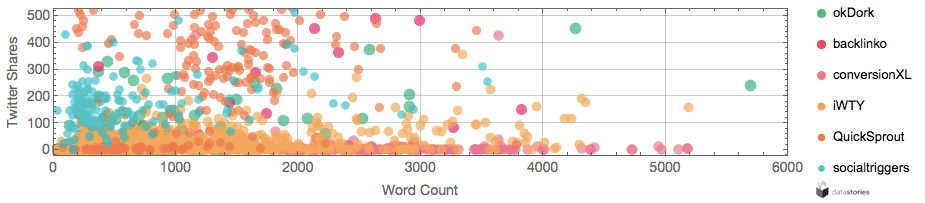
Word count varies from blog to blog. Backlinko, OkDork, IWT like long and super-long posts of more than 2000 words:
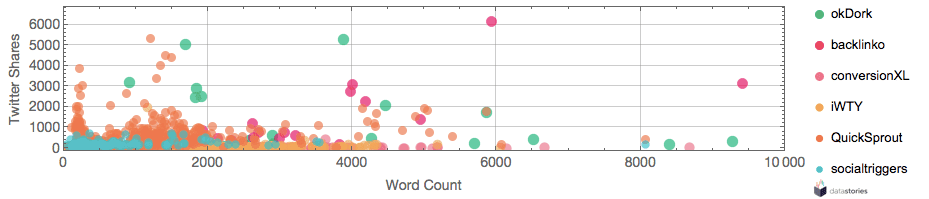
Socialtriggers prefers posts with less than 1000 words, while Quicksprout has specific preferences for either short 250-300 word posts or 1000-2000 words:
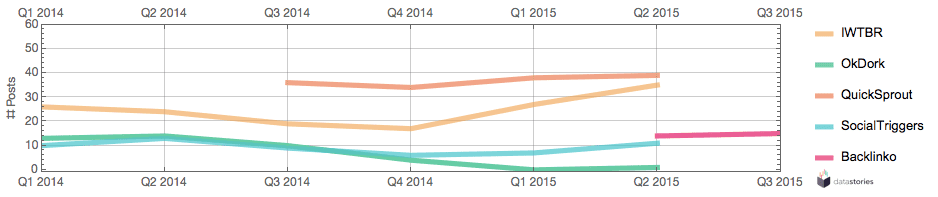
Let's look at posting evolution for all giants over time
For up to date information we only selected the posts published since January 2014 and did the analysis of main blog metrics on quarterly basis. Normally calculating average values per quarter would depend on the "outliers", e.g. posts which went viral. That's why we also did the robust stability analysis which led to same conclusions. If you want to see the results - contact us.
Look at the differences in posting frequency per quarter since 2014. OkDork has been getting quieter since Q3 2014. Quicksprout outputs 35-40 posts per quarter. Ramit Sethi has been ramping up his output significantly since Jan 2015.
Average FACEBOOK SHARES per POST are quite different among the blogs. We clearly see that social sharing is not everyone's focus and there are good reasons for that. Note the backlinko, for whom we've got data since Q2 2015 has a quickly growing trend in avg shares per post:
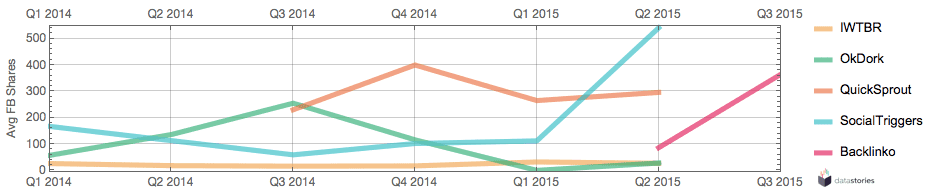
Note, that we did not have a complete information for Q3 2015 which is just over, and that's why we don't plot the metrics for other blogs except backlinko. The amazing thing about backlinko is that we only 29 posts in our dataset the blog has very impressive social sharing metrics. If shares are the goal, and time is tight Brian Dean from backlinko might have a process which falls into the growth hacking category.
[Note, Backlinko is in operation since July 2012. Thanks, Jascha Brinkmann for pointing this out. We've only got and analysed post data visible on backlinko.com/blog.]
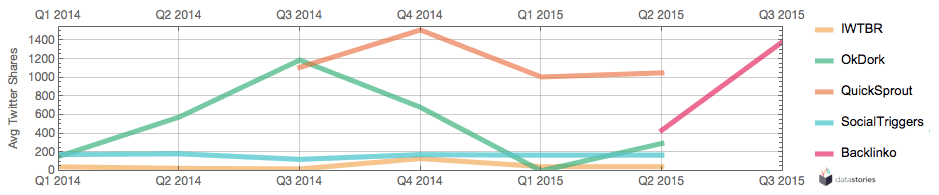
Average TWITTER SHARES per POST show similar trends. Note, that Q3 2015 might have incomplete information. Can you guess which blogs have social shares as their target metrics?
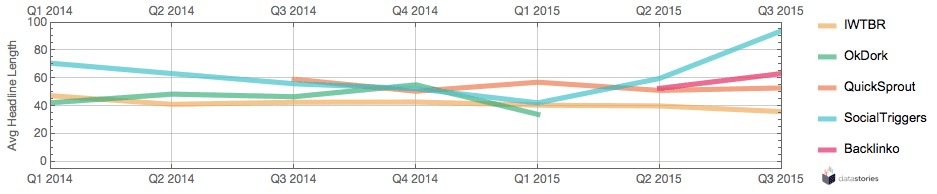
Average HEADLINE LENGTH per POST quite similar for all blogs - something between 40 and 60 characters is a golden range:
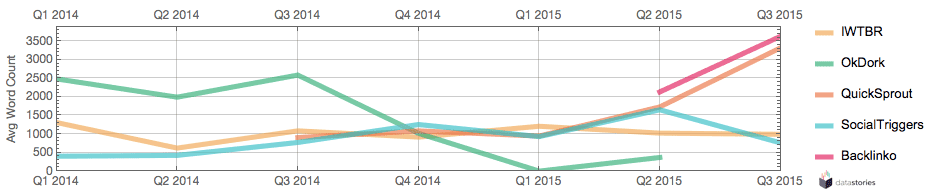
Average WORD COUNT per POST differs a lot. Socialtriggers have been ramping it up. Backlinko started writing super-long posts.
Weekday to post to get shares ranges significantly among blogs. The only general conclusion is to not post on weekend.
We analysed the data with respect to specific patterns in the weekday of posting and social shares. If all 2,831 posts are considered as one pile - the results are inconclusive.
PLAY with the GRAPH below to see how twitter shares and weekdays are related. CLICK on the legend to skip or select blogs of interest.
Loading....
For individual blogs the only reliable observations we can make are the following:
- Quicksprout has the most data across weekdays. For Quicksprout Friday and Wednesday are the best days to post (with av. tweets per post being 1,209 and 1,236). These days are statistically significantly better than Monday (av. tweets 762) and Thursday (av. tweets 526).
- For SocialTriggers Monday and Thursday are significantly different from Friday.
- For OkDork Monday and Tuesday are better than Wednesday. And Wednesday is significantly better than Thursday and the weekend.
- For IWillTeachYouToBeRich the day does not really matter much.
- Backlinko's favorite posting day in Monday.
- Weekends do not get many shares across all blogs.
Headlines:
Headline properties like length and neutrality have been appearing as the driving variables in predicting social shares and number of comments on several occasions. You can find the details below. Two main conclusions here:
- Headlines should not be neutral - the higher neutrality the less social shares and comments.
- Longer posts should have longer headlines. If your headline is short, the post must be short as well, or the social shares will go down.
We were curious ourselves to see which words are usually present in successful headlines, and made this little tool to explore the headlines further.
Try the words market (this is normalized version of marketing), conversion, linkedin, email, share.
Content analytics.
We also looked at all posts as a whole - 2931 post in total, and applied our text analytics routines to see whether any particular clusters of posts will emerge.
All 2831 posts form five distinct clusters!
We named the resulting segments A,B,C,D,E,F and calculated the average stats for them. The results are interesting!
The table below shows most representative words for each post segment:
| Name | Tweets | Top 10 Words for each group of posts |
|---|---|---|
| A | money, earn, finance, comment, blog, friday, update, post, new, personal, diary, free, entrepreneur, get, entrepreneurship, make, series, psychology, email, name | |
| B | comment, blog, update, free, post, new, get, email, name, ramit, week, rich, book, study, year, job, case, read, win, invest | |
| C | identify, add, page, post, leadbox, card, calculator, credit, ultimate, banner, otherwise, guide, comment, blog, update, free, get, new, save, money | |
| D | people, get, make, want, think, go, business, know, thing, work, one, time, like, new, company, say, good, great, would, free | |
| E | test, page, conversion, customer, use, people, product, make, site, user, good, one, design, like, email, image, website, visitor, rate, need | |
| F | content, link, site, traffic, social, search, use, blog, post, google, page, rank, image, people, infographic, create, like, make, write, share |
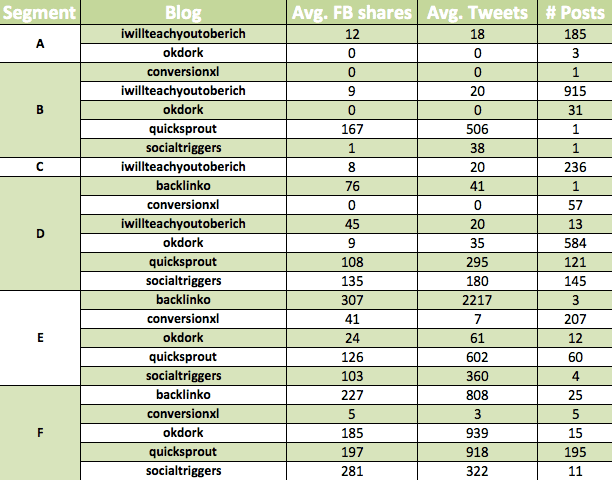
Below we show the average number of facebook and twitter shares per content cluster for each individual blog.
Note, that while for most blogs the social shares increase towards segments E and F, Quicksprout does very well in segment B. Cluster C (represented by words card, calculator, credit, ultimate, banner, otherwise, guide, comment, blog, update, free, get, new, save, money) is entirely monopolised by Ramit Sethi from IWT.
Predictive Analytics
We ran each individual blog data throughdataStories to understand which blog metrics impact social shares. In all cases models of sufficient accuracy could be created, and in all cases the metric drivers are different:
Backlinko
ConversionXL
IWT
At last we've tried to train a large deep learning model to see which words from the content of all individual blogs are used in the same context.
Note, these are no synonyms, but similar words used in the same context. Under the table you can check which fraction of the posts per blog uses the word you typed, and how many times in total the word is used.
Neutrality Analysis:
During the sentiment analysis of individual post content and headlines we assigned two sentiment scores to each post. The post itself can be labeled as positive, negative or neutral, and it's headline can also be positive, negative, or neutral.
As we mentioned above being neutral does not help to get social shares and here is the proof. In the tables below we look at the average and median share counts for posts having particular combinations of sensitivity scores.
For the simple statistical overview below we selected the most recent posts from 2014-2015 (430 posts) and added all posts from ConversionXL with at least one tweet (100 posts), to get 530 posts in total. ConversionXL does not mention the date of the post, so we could not identify the most recent posts.
We discovered, that a NEUTRAL headline alone is insufficient predictor of social shares. The content of the post itself has to be taken into account!
Posts with NEUTRAL headline & NEUTRAL content get shared the WORST, while with POSITIVE headline & content - the BEST of all posts!
The statisticians among us would need to see the median values per group. They are [37, 31, 151] for twitter shares, [14, 16, 97] for fb shares, and [18, 18, 97] for fb likes for negative, neutral and positive combinations respectively.
It pays off to be positive in headlines and content.
Posts with NEUTRAL CONTENT get shared the WORST!
Look at the average social shares per post neutrality. HOVER over the graph for more info:
The median shares are [106, 33, 204] for twitter shares, [47, 16.5, 102] for fb shares, and [60, 19.5, 83] for fb likes for negative, neutral and positive combinations respectively.
Voila! The data clearly demonstrates that neutrality in your language reduces the chance for your posts to be read and shared. Express an opinion and show personality. Facebook values both extremes of polarity. Twitter rewards being positive.
If you want to evaluate the sentiment of your drafts, check it here.
Concluding Observations:
Blogs are ordered alphabetically.
Backlinko.com by Brian Dean
- Brian seems to have found the magic hack of making super-shareable content. With 29 blogs published since June 2015 he's got an average of 927 twitter shares per post.
- Backlinko loves to publish on Mondays and has fairly long posts of 3000 words on average (!).
- The main drivers of success for backlinko are very long headlines (predictive models set the optimum at 80 characters and longer), posting early in the week, anti-neutral post content, and lot of external links. The optimum link number for maximizing twitter shares is 50 to 60. (while 40 links is much worse than 70). Number of images is a driver for tweets (but not for facebook shares or likes).
- Interestingly, only one single post of backlinko has content recognized as neutral. Brian is very personal in his posts! Maybe this is his trick? (This and lots of external links). 55% of all posts (16 out of 29) have positive sentiment, and 41% has negative sentiment, but in terms of headlines, most of them are neutral (55%, or 16 posts).
ConversionXL by Peep Laja
- ConversionXL has lots of posts! Out of 270 posts 47% have positive sentiment and 29% have negative sentiment.
- Our models say that the optimal number of external links us 40-50. The headline length at 60 characters, the word count about 5000 words, 10 or less images, and least neutral content.
- We did not have any date or weekday information, so we couldn't check the trends or frequency for all posts.
IWillTeachYouToBeRich by Ramit Sethi
- Ramit is a content machine! He published 1350 stories since 2004(!)
- It looks like some of the content of Ramit is timeless. People are still sharing his posts from 2005.
- Social shares are clearly not the goal for Ramit. His posts do not get mindblowing sharing, but we think it's because the audience wants to keep it for themselves. We do not have data on Ramits' email list or subscriber evolution, but Ramit is smart, and if he keeps posting - his metrics of focus should be doing well.
- Ramit even ramped up his output since the beginning of 2015 from 18 to 38 posts per quarter!
- IWT's sentiment is quite "politically correct" (aka neutral). 43% of his posts (or 585 stories) have neutral sentiment, and 53% have a neutral headline. Only 29% of content has positive sentiment and 20% has positive headlines. Maybe something to think about?
- Our models say the shorter headlines will improve shares (30 to 40 characters), word count should be the bigger the better, and neutrality needs to go down (if shares are the goal).
OkDork by Noah Kagan
- We already analyzed OkDork's posts from 2014 extensively in this private post here, but there are several new observations:
- Noah made a whopping number of 645 posts since July 2005! 2008 and 2011 were the quietest years, but there is a serious growth in popularity of his posts in 2013 and 2014 with an average number of tweets per post of 595 in 2014 (for 42 posts).
- Noah's posting frequency has dropped down significantly since the fall of 2015. It looks like he is off again after a grand project (SumoMe?)
- The sentiment over all posts was divided almost equally (40% negative, 32% neutral, and 32% positive), but in 2014 52% of his posts has positive sentiment, 28% negative, and only 22% neutral. Positive sentiment attracts significantly more shares.
Quicksprout by Neil Patel
- Quicksprout is a potent blog as well - 378 posts since 2007 (with breaks in 2008, 2009, and 2011)!
- Out of 150 posts publishes since 2013, Neil has an average 1,162 tweets per post - this is the highest average over all giants we considered.
- Our models indicate the sharing is maximized when the headline is either under 40 characters or superlong (longer than 100), the number of external links is no more than 10, and publishing day is Wednesday.
- Most of Neil's posts have positive sentiment - 57% or 214 posts. The all time average for positive posts is 787 (including posts from years when twitter was barely there), which is quite high.
SocialTriggers by Derek Halpern
- Derek started his blog in March 2011 and created 161 stories since. His all time average is 195 tweets per post.
- Derek likes being very personal. 50% of his posts have negative sentiment, and only 12% are neutral. The social shares for socialtriggers are again significantly better for polar then neutral posts, and it worked well for them.
- The optimal number of external links according to our models shoudl be 9-10, and the word count can go to 4,000 words and higher to maximize shares.
- The most influential words in Derek's posts are "create", "free", "share", and "traffic."
Conclusions:
We’ve analyze all the data, and here are the end conclusions:
Making a post “neutral” is the worst thing you can do. Post should have high polarity: Meaning it should be either fun and person, or highly controversial. Test your copy here.
The more links you use in your posts, the more it will be shared. Optimal level between is around 10 for most sites (Backlinko has an optimum of 50 external links per post).
Optimal word length is super high: 4,000+ words per post (going to 6,000 and higher). 4,000+ word posts seem to be the new normal for highly-shared posts.
Consistency really matters. Like...REALLY. These popular bloggers pump out between 1 - 3 posts every WEEK.
The optimal headline length for popular posts is between 50 and 100 characters. The only exception is Ramit who's predicted optimum lies at 40 characters. Also having exact numbers in the headline doesn't have a correlation to higher shares.
Make friends in your industry community. The data shows these top bloggers tend to mention each other and even devote posts to one another.
The data shows no "best day" to post…..just never on a Saturday. Every blog has different "best days", and thedata shows no correlation. However the one thing the data shows is Saturday is ALWAYS the worst day to post.